Ignoring the minimum supply voltages specified in the datasheets is simply no good idea.
MH-Z19 offset and scale differences!?
Moderators: grovkillen, Stuntteam, TD-er
-
chunter1
- Normal user
- Posts: 82
- Joined: 22 Jan 2016, 22:40
Re: MH-Z19 offset and scale differences!?
-
Shardan
- Normal user
- Posts: 1156
- Joined: 03 Sep 2016, 23:27
- Location: Bielefeld / Germany
Re: MH-Z19 offset and scale differences!?
Agree.chunter1 wrote: 10 Nov 2017, 13:20Ignoring the minimum supply voltages specified in the datasheets is simply no good idea.
The "3,6V" on many sensors, not only the MH-Z19 have a certain reason:
These sensrs use an internal CPU running on 3.3V. This 3,3V are provided from a voltage regulator,
LM1700, AM1117-3.3 or whatever similar is in the garbage bag of the manufacturer.
These regulators need a bit of voltage for themselves to work correctly, the so called drop-out voltage.
If you feed the circuit below recommended minimum voltage, the onboard regulator simply can't do his job,
delivering constant voltage to CPU and the sensor itself.
Even if the sensor is still running i won't trust any readings from that sensor.
Regards
Shardan
Shardan
-
chunter1
- Normal user
- Posts: 82
- Joined: 22 Jan 2016, 22:40
Re: MH-Z19 offset and scale differences!?
In the past few weeks, i had the opportunity to test several different CO2 sensors side by side.
Each sensor (except the netatmo ofcourse) was connected to it's own ESP8266, all running the same ESPEasy firmware.
The power-supplies used were also of same type.
Sensors unter test:
- MH-Z19 (old version)
- MH-Z19B
- Senseair S8
- Netatmo
Results:
From the observation of the CO2"-curves over time, i come to the following conclusion:
a) The Netatmo and the Senseair S8 Sensor correlated very well over time.
Curves were quite smooth without significant correction-jumps.
Measurements seem to be the most trustworth and comprehensible.
b) Compared to the Natatmo and Sensair S8, the MH-Z19B measurements also correlate quite well over several hours.
However auto calibration sometimes kicks in radically resulting in large jumps and constant offsets.
Though, ventilating the room more often helps bringing the sensor back to plausible measurements after a while, it's not that reliable.
In my oppinion, the Netatmo and Senseair S8 show a more advanced auto-calibration implementation.
c) The old MH-Z19 version almost always measured too low CO2 values (compared to the Netatmo).
Very seldomly a kind of base-line calibration was observed that raised the curve - however never that high to really correlate with the others.
Find attached a diagram that shows the "most observed relation" of the sensor measurements.
Please ignore the curve named "Senseair" since that sensor was somewhat misconfigured!!
To come to a conclusion, my personal choice is absolute clearly the Senseair S8 because of it's good measurement continouity and flawless automatic baseline calibration.
There is nothing worse than having a sensor that you can not rely on.
However, if you REALLY can accept part-time offsets and jumps, then the MH-Z19B sensor is "ok" for it's price.
You do not have the required permissions to view the files attached to this post.
-
TD-er
- Core team member
- Posts: 10214
- Joined: 01 Sep 2017, 22:13
- Location: the Netherlands
Re: MH-Z19 offset and scale differences!?
If you run the latest version, you can disable the automatic base calibration of the MH-Z19.
In the Mega branch, you can even use the "unstable" measurements if you like (or need to due to unstable air)
In the Mega branch, you can even use the "unstable" measurements if you like (or need to due to unstable air)
-
batal131
- Normal user
- Posts: 21
- Joined: 20 Dec 2017, 08:23
Re: MH-Z19 offset and scale differences!?
Happy to find this forum and this topic 
Already ordered few S8, but also have pair of MH-Z19 and pair of MH-Z19B.
And my own tests are pretty the same as chunter1's! (for comparing 19 and 19B).
MH-Z19 always shows ppm in about 200 less then MH-Z19B. Even after few days in well ventilated room.
My plans currently (while waiting for S8) is to play with disabling ABC (with manual calibration) and again compare 4 sensors that I have ( I know that old MH-Z19 is crap).
(currently my both MH-Z19B not working properly on dev12, so I need to compile my own firmware from sources or wait for dev13)
-
grovkillen

- Core team member
- Posts: 3621
- Joined: 19 Jan 2017, 12:56
- Location: Hudiksvall, Sweden
Re: MH-Z19 offset and scale differences!?
Welcome and I would love to see some graphs comparing the sensors side by side (like chunter1 did).batal131 wrote: 20 Dec 2017, 08:33 Happy to find this forum and this topic
Already ordered few S8, but also have pair of MH-Z19 and pair of MH-Z19B.
And my own tests are pretty the same as chunter1's! (for comparing 19 and 19B).
MH-Z19 always shows ppm in about 200 less then MH-Z19B. Even after few days in well ventilated room.
My plans currently (while waiting for S8) is to play with disabling ABC (with manual calibration) and again compare 4 sensors that I have ( I know that old MH-Z19 is crap).
(currently my both MH-Z19B not working properly on dev12, so I need to compile my own firmware from sources or wait for dev13)
ESP Easy Flasher [flash tool and wifi setup at flash time]
ESP Easy Webdumper [easy screendumping of your units]
ESP Easy Netscan [find units]
Official shop: https://firstbyte.shop/
Sponsor ESP Easy, we need you
ESP Easy Webdumper [easy screendumping of your units]
ESP Easy Netscan [find units]
Official shop: https://firstbyte.shop/
Sponsor ESP Easy, we need you
-
batal131
- Normal user
- Posts: 21
- Joined: 20 Dec 2017, 08:23
Re: MH-Z19 offset and scale differences!?

Here is my tests of 4 sensors:
MH-Z19B (named with ABC)
MH-Z19B with ABC turned off
MH-Z19 (named with ABC)
MH-Z19 with ABC turned off (I know that there is nothing about ABC in MH-Z19 datasheet, but I've tried to turn it off)
All 4 sesnosrs installed on one breadboard (and its about 2cm between each of them). All powered from the same source. All transmitting data with similar Wemos D1 mini.
Tests performed for 2 weeks (MH-Z19B datasheet says that ABC period is 1 day)
Some thoughts:
1) ABC does nothing in my environment (living room). Completely no difference for MH-Z19B with ABC and without ABC.
2) MH-Z19 always shows less PPM than MH-Z19B. Sometimes difference is very big (about 400-500ppm).
3) ABC (MH-Z19B only):
When ABC is turned on, "U" continuously increases from 0 to about 37 000 when its self-calibrating (24h ABC period).
When ABC is turned of, "U" always 0.
4) Internal temperature difference between MH-Z19 and "B" is about 6 degrees (Celsius). MH-19B heats more because of higher measurement frequency (in about 2 times as I can see on red blinking)
5) Boards with MH-Z19B has some problems with stability. They restarts in maximum 30 minutes (usually uptime is only 4-5 minutes). Boards with MH-Z19 does not have this problem and uptime is few days. With S8 I'll try to replace all boards to see if this helps. And I'll try to configure Syslog server to investigate this.
Sensair S8 arrives in few days. I'll replace one of MH-Z19 with it and continue testing.
BTW, does anyone knows, is it possible to connect multiple CO2 sensors to the one Wemos?
You do not have the required permissions to view the files attached to this post.
-
TD-er
- Core team member
- Posts: 10214
- Joined: 01 Sep 2017, 22:13
- Location: the Netherlands
Re: MH-Z19 offset and scale differences!?
Can you also write down what color in the graph what sensor is?batal131 wrote: 05 Jan 2018, 09:20 [...]
Some thoughts:
1) ABC does nothing in my environment (living room). Completely no difference for MH-Z19B with ABC and without ABC.
2) MH-Z19 always shows less PPM than MH-Z19B. Sometimes difference is very big (about 400-500ppm).
3) ABC (MH-Z19B only):
When ABC is turned on, "U" continuously increases from 0 to about 37 000 when its self-calibrating (24h ABC period).
When ABC is turned of, "U" always 0.
4) Internal temperature difference between MH-Z19 and "B" is about 6 degrees (Celsius). MH-19B heats more because of higher measurement frequency (in about 2 times as I can see on red blinking)
5) Boards with MH-Z19B has some problems with stability. They restarts in maximum 30 minutes (usually uptime is only 4-5 minutes). Boards with MH-Z19 does not have this problem and uptime is few days. With S8 I'll try to replace all boards to see if this helps. And I'll try to configure Syslog server to investigate this.
Sensair S8 arrives in few days. I'll replace one of MH-Z19 with it and continue testing.
BTW, does anyone knows, is it possible to connect multiple CO2 sensors to the one Wemos?
About your last question. You can only add more than one when using different pins.
The MHZ19 plugin uses the SoftSerial code, which allows multiple instances to be used.
In the last Mega code, I changed it to max. 3 simultaneous instances on the same device. Because you simply do not have more pins to use Rx and Tx on an ESP8266 and it will reduce the amount of cache ram used. (which is really sparse)
Also make sure your power supply is sufficient. These sensors may peak during a measurement. If all sensors peak at the same time, the voltage may drop due to resistance in the power cables, or even because the power supply may not deliver.
One sensor may peak up to 150 mA if I'm correct. So 4 sensors may peak up to 600 mA.
Also these sensors really should run on 5V, not 3.3V.
I have several of these sensors here and they almost never reset themselves.
Perhaps you should add some capacitors over the Vcc lines of the sensors.
If the sensor reboots, it may affect the ABC functionality.
The U value is believed to reflect the raw internal value reflecting the lowest concentration recorded in the last 24h. The sensor will consider this then as the new 400 ppm point.
So if you did not ventilate enough, the lowest recorded concentration may actually be way above 400 ppm and thus the displayed value will be too low and may show hours of 400 ppm recorded values.
Do you also have the values stored in some kind of CSV? Then you can create a scatter plot in Excel.
I did this for S8, MHZ19A and MHz19B (only very short interval of 22 hours):
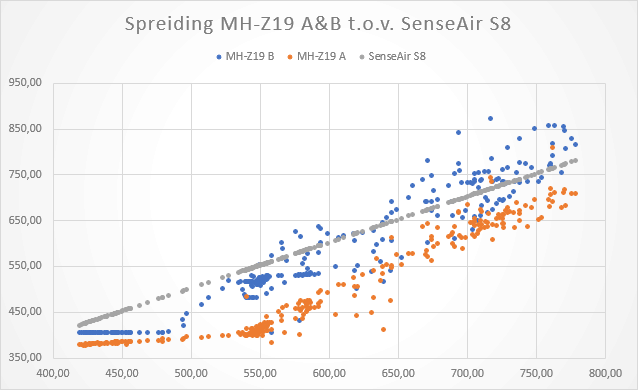
Horizontal axis shows the ppm values of the S8 sensor (considered to be the "truth", since I just opened the package of the sensor and it had still factory calibration)
Vertical is the concentration of all 3 sensors at the same time.
So then you can see if the sensors agree (for example the S8 agrees very well with itself
If one may react faster or slower, the average should still be the same.
Edit:
One not to myself; I may have swapped the data from the A and the B sensor, since the A never gets below 400 ppm and the B version may give a bit lower values.
-
batal131
- Normal user
- Posts: 21
- Joined: 20 Dec 2017, 08:23
Re: MH-Z19 offset and scale differences!?
1) Right under graph you can see legendTD-er wrote: 06 Jan 2018, 12:46 Can you also write down what color in the graph what sensor is?
About your last question. You can only add more than one when using different pins.
The MHZ19 plugin uses the SoftSerial code, which allows multiple instances to be used.
In the last Mega code, I changed it to max. 3 simultaneous instances on the same device. Because you simply do not have more pins to use Rx and Tx on an ESP8266 and it will reduce the amount of cache ram used. (which is really sparse)
Also make sure your power supply is sufficient. These sensors may peak during a measurement. If all sensors peak at the same time, the voltage may drop due to resistance in the power cables, or even because the power supply may not deliver.
One sensor may peak up to 150 mA if I'm correct. So 4 sensors may peak up to 600 mA.
Also these sensors really should run on 5V, not 3.3V.
I have several of these sensors here and they almost never reset themselves.
Perhaps you should add some capacitors over the Vcc lines of the sensors.
If the sensor reboots, it may affect the ABC functionality.
The U value is believed to reflect the raw internal value reflecting the lowest concentration recorded in the last 24h. The sensor will consider this then as the new 400 ppm point.
So if you did not ventilate enough, the lowest recorded concentration may actually be way above 400 ppm and thus the displayed value will be too low and may show hours of 400 ppm recorded values.
Do you also have the values stored in some kind of CSV? Then you can create a scatter plot in Excel.
I did this for S8, MHZ19A and MHz19B (only very short interval of 22 hours):
Horizontal axis shows the ppm values of the S8 sensor (considered to be the "truth", since I just opened the package of the sensor and it had still factory calibration)
Vertical is the concentration of all 3 sensors at the same time.
So then you can see if the sensors agree (for example the S8 agrees very well with itself
If one may react faster or slower, the average should still be the same.
Edit:
One not to myself; I may have swapped the data from the A and the B sensor, since the A never gets below 400 ppm and the B version may give a bit lower values.
2) I've investigated reboot problem and found that problem is in "Generic HTTP Advanced". When I've switched to "Generic HTTP" - reboot problems gone. (I know that Advanced still in "testing")
3) There are no problems with power supply. I've checked different power sources - no changes.
4) I'm powering sensors directly from power supply, so if wemos reboots - this does not affect sensors. I can even remove wemos at all - and all sensors will continue blinking
5) About CSV and scatter - good idea, I'll do that lately.
I'm currently testing following sensors
1) Sensair S8 (0053)
2) MH-Z19B with ABC turned off (I've turned it off when it was in good ventilated room for few days, so calibration is good)
3) MH-Z19B with ABC.
I've started testing only 3 days ago and as I can see now - MH-Z19B (both versions) performs not bad. Max difference between all 3 sensors is only about 100ppm (max ppm was about 1600, min 400).
Of course I'll post graphs after at least 10 days of testing (as S8 has 8 days ABC). And I'll prepare scatter plot in Excel also
BTW, I've paid 20$ for MH-Z19B and only 36$ for Sensair S8. As for now I thing it's fair price for both of them.
-
TD-er
- Core team member
- Posts: 10214
- Joined: 01 Sep 2017, 22:13
- Location: the Netherlands
Re: MH-Z19 offset and scale differences!?
About 1), simply overlookedbatal131 wrote: 09 Jan 2018, 09:00 1) Right under graph you can see legend
2) I've investigated reboot problem and found that problem is in "Generic HTTP Advanced". When I've switched to "Generic HTTP" - reboot problems gone. (I know that Advanced still in "testing")
3) There are no problems with power supply. I've checked different power sources - no changes.
4) I'm powering sensors directly from power supply, so if wemos reboots - this does not affect sensors. I can even remove wemos at all - and all sensors will continue blinking
5) About CSV and scatter - good idea, I'll do that lately.
I'm currently testing following sensors
1) Sensair S8 (0053)
2) MH-Z19B with ABC turned off (I've turned it off when it was in good ventilated room for few days, so calibration is good)
3) MH-Z19B with ABC.
I've started testing only 3 days ago and as I can see now - MH-Z19B (both versions) performs not bad. Max difference between all 3 sensors is only about 100ppm (max ppm was about 1600, min 400).
Of course I'll post graphs after at least 10 days of testing (as S8 has 8 days ABC). And I'll prepare scatter plot in Excel also
BTW, I've paid 20$ for MH-Z19B and only 36$ for Sensair S8. As for now I thing it's fair price for both of them.
When you reboot, could you test with the latest source to see if the problems with the Generic HTTP Advanced are now fixed?
If you do the scatter plot, then you can see how well they correlate. And even 100 ppm off is not bad, as long as the average offset is close to 0. Some sensors may react slower, or faster to changes due to internal filtering.
But that also means they will show a shift in time on rise and fall of the curve. However the rise of CO2 concentration may still be more steep than the fall of the concentration.
For example when cooking on gas, the CO2 levels increase really fast, but they take more time to go back to lower levels, with people in the same room.
It is quite fascinating to look into these figures
-
batal131
- Normal user
- Posts: 21
- Joined: 20 Dec 2017, 08:23
Re: MH-Z19 offset and scale differences!?
Ok, I'll try to update to latest version.TD-er wrote: 09 Jan 2018, 09:15 When you reboot, could you test with the latest source to see if the problems with the Generic HTTP Advanced are now fixed?
Currently MH-Z19B without ABC is very good correlated with S8 (with factory calibraion).TD-er wrote: 09 Jan 2018, 09:15 If you do the scatter plot, then you can see how well they correlate. And even 100 ppm off is not bad, as long as the average offset is close to 0. Some sensors may react slower, or faster to changes due to internal filtering.
But that also means they will show a shift in time on rise and fall of the curve. However the rise of CO2 concentration may still be more steep than the fall of the concentration.
For example when cooking on gas, the CO2 levels increase really fast, but they take more time to go back to lower levels, with people in the same room.
It is quite fascinating to look into these figures
And yes, we have gas oven, so sometimes I have >1500ppm
Both MH-Z19Bs are reporting raw values, not sure if I need to change theirs filters.
-
TD-er
- Core team member
- Posts: 10214
- Joined: 01 Sep 2017, 22:13
- Location: the Netherlands
Re: MH-Z19 offset and scale differences!?
The filters I created are only making it less responsive.batal131 wrote: 09 Jan 2018, 10:08 [...]
Both MH-Z19Bs are reporting raw values, not sure if I need to change theirs filters.
And the option "Use unstable readings" (or how it is called) does not have effect on the B version. Only on the A version.
It should make the A and B version behave the same. (based on what I think the B version does internal)
-
batal131
- Normal user
- Posts: 21
- Joined: 20 Dec 2017, 08:23
Re: MH-Z19 offset and scale differences!?
Updated all 3 boards to latest sources (manually compiled) - still has problems with one board (reboots every 10-15 minutes).TD-er wrote: 09 Jan 2018, 09:15When you reboot, could you test with the latest source to see if the problems with the Generic HTTP Advanced are now fixed?
All boards identical (wemos mini 3.0.0). Bought together.
Currently (with HTTP Advanced) 2 of 3 boards works ok (no reboots). One reboots every 10 minutes
With Generic HTTP no problems.
Logs are empty (with level 4).
-
batal131
- Normal user
- Posts: 21
- Joined: 20 Dec 2017, 08:23
Re: MH-Z19 offset and scale differences!?
Implemented scatter
ppm reported every 1 minute. For graph grouped by 5 minutes. Data for last day (after 5 days of running)
And basic chart (same data)
average difference for MH-Z19B without ABC is only 41 ppm! For ABC version is 95 ppm (and its increasing each day, damn 1 day calibration)
ppm reported every 1 minute. For graph grouped by 5 minutes. Data for last day (after 5 days of running)
And basic chart (same data)
average difference for MH-Z19B without ABC is only 41 ppm! For ABC version is 95 ppm (and its increasing each day, damn 1 day calibration)
You do not have the required permissions to view the files attached to this post.
-
TD-er
- Core team member
- Posts: 10214
- Joined: 01 Sep 2017, 22:13
- Location: the Netherlands
Re: MH-Z19 offset and scale differences!?
That looks quite nice, the scatter plot.
So if you're running for a while, the version with ABC should show some drift and thus a wider band?
Also interesting to "swap" the data by placing other sensors on the X-axis.
So if you're running for a while, the version with ABC should show some drift and thus a wider band?
Also interesting to "swap" the data by placing other sensors on the X-axis.
-
batal131
- Normal user
- Posts: 21
- Joined: 20 Dec 2017, 08:23
Re: MH-Z19 offset and scale differences!?
Yes, I'll create different graphs after few weeks of testingTD-er wrote: 12 Jan 2018, 15:18 That looks quite nice, the scatter plot.
So if you're running for a while, the version with ABC should show some drift and thus a wider band?
Also interesting to "swap" the data by placing other sensors on the X-axis.
BTW, have you checked latest datasheet for MH-Z19B? I've found only Chinese version
http://style.winsensor.com/pro_pdf/MH-Z19B.pdf
-
batal131
- Normal user
- Posts: 21
- Joined: 20 Dec 2017, 08:23
Re: MH-Z19 offset and scale differences!?
Small update.
Room wasn't ventilated properly for 26 hours (it was just before previous calibration). And now MH-Z19B (ABC) calibrated. From +100ppm (comparing to S8) to -100ppm...
Lowest ppm during last 24h was 600ppm. So MH-Z19B now thinks that this 600ppm is 400ppm... Terrible behavior.
Room wasn't ventilated properly for 26 hours (it was just before previous calibration). And now MH-Z19B (ABC) calibrated. From +100ppm (comparing to S8) to -100ppm...
Lowest ppm during last 24h was 600ppm. So MH-Z19B now thinks that this 600ppm is 400ppm... Terrible behavior.
-
TD-er
- Core team member
- Posts: 10214
- Joined: 01 Sep 2017, 22:13
- Location: the Netherlands
Re: MH-Z19 offset and scale differences!?
This one is more readablebatal131 wrote: 15 Jan 2018, 14:20 [...]
BTW, have you checked latest datasheet for MH-Z19B? I've found only Chinese version
http://style.winsensor.com/pro_pdf/MH-Z19B.pdf
-
batal131
- Normal user
- Posts: 21
- Joined: 20 Dec 2017, 08:23
Re: MH-Z19 offset and scale differences!?
Yep, but mine is newerTD-er wrote: 15 Jan 2018, 16:52 This one is more readable
-
batal131
- Normal user
- Posts: 21
- Joined: 20 Dec 2017, 08:23
Re: MH-Z19 offset and scale differences!?
I've finished with my tests (MH-Z19B vs SenseAir S8).
So, finally MH-Z19B is very good with ABC turned OFF (and properly calibrated, of course).
At the same time MH-Z19B very bad if you room not ventilated every day.
Here is graph of two MH-Z19B (both with ABC turned OFF!) and one S8. Average difference (comparing to S8) is 1ppm and 10ppm.
So, finally MH-Z19B is very good with ABC turned OFF (and properly calibrated, of course).
At the same time MH-Z19B very bad if you room not ventilated every day.
Here is graph of two MH-Z19B (both with ABC turned OFF!) and one S8. Average difference (comparing to S8) is 1ppm and 10ppm.
You do not have the required permissions to view the files attached to this post.
Who is online
Users browsing this forum: Ahrefs [Bot], Anthropic Claude Bot [bot], Bing [Bot], Unknown bot [bot] and 2 guests